
Officials Performance - FABA Season 2023
Ignacio M. Galasso
Date: 25/05/23 - 16/10/23
1. Summary:
The following work was able to measure and quantify the performance of the officials during the 2023 FABA tournament. It is the beginning of carrying out annual actions to improve officers' performance year after year. In addition to helping them to develop as a group and as individuals.
2. Introduction:
The following analysis is carried out to determine the officials' performance during the American football season. An attempt will be made to detect the most common failures. Also, with the analysis, we will establish a performance number to serve as a point of comparison for subsequent years. In addition, it seeks to find aspects of refereeing to improve.
To achieve our hypotheses, we are going to use as sources:
With the analysis, it is expected to find a favorable annual performance greater than or equal to 90% of the total plays. This implies that errors should not represent more than 10% of the total plays throughout the year.
3. Methodology:
To study the data, Google Sheets was used, and the spreadsheet “Datos_desimpeño_Oficiales.xlsx” was created as a spreadsheet, in which all the data will be collected and unified for analysis. With the videos of the games, we count the total number of plays that occurred in each game, and the quarter of play will be extracted. The data from the “Planilla Revisión FABA 2023” file will be transcribed into the “Datos_desimpeño_Oficiales.xlsx” form, but its purpose is to individualize the data. It is similar to applying a filter by an officer, but now displayed in each tab.
The calendar will help us identify the games and their corresponding dates. The designation sheet will be used to reaffirm the crews and correct errors.
In the “Datos_desempeño_Oficiales” form, formulas will be applied to speed up the loading of the data. We will only seek to know the performance percentage number of the officers in the year.
Tableau will be used to visualize the numbers in greater detail and to help the data understanding. It will be an attempt to show the performance by date, by officers, and the percentages they represent on each date.
4. Results:
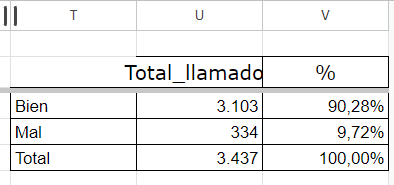
After transcribing the data and verifying that they were all correct and that they did not present biases in their loading, it was concluded that the percentage of good calls was within the expected number. Of a total of 3,437 calls, 3,103 were good calls, representing a total of 90.28%. The total of bad calls was 334, which represents 9.72% of the total calls in the entire FABA tournament. Here the table from the “Datos_desempeño_Oficiales” form shows us this:
5. Analysis and Interpretation:
With this analysis, it was possible to quantify the performance of the officers, something we wanted to do for a long time. Now we have in numbers the errors that were previously intuited, but the most important thing is that now we have a tool that allows us continuity in our analysis and, with the results, we can make year-to-year comparisons of the performance of both the new officers as well as the more experienced ones. In addition, we will be able to know if the performance increases or decreases compared to next year.
We will see if the actions taken to improve the most negative situations have managed to meet their objectives. As was the case this year, when it was found that the biggest errors were in the mechanics, actions can be taken to improve this particular aspect. Then, with the reviews of next year's matches, it will be possible to anticipate whether the measures adopted were correct or whether others need to be applied.
In the “Datos_desempeño_Oficiales” form, there is a tab with the name “Faltas”, which allows you to identify the foul(s) in which the officers have had the most difficulties, and you can work to analyze whether there were conceptual errors or whether they were simply being applied in the wrong way. Each official will be able to know their total performance individually in the year and by game in which officials participated. Yes, we know that with the weekly reviews, the officials already know their errors and successes; now they have data that quantifies them. They will be able to measure their performance year by year. In addition, each official will be able to know the position they most officiated.
6. Reviewed or Confirmed Hypotheses:
The measures to be taken in mechanics will have to be analyzed. We have to keep in mind that the new officers will present a high percentage of failures in mechanics because they are adjusting to their new role. For more experienced officers, this type of error should decrease day by day.
7. Discussion:
One of the drawbacks of our analysis is that there is the possibility of making errors when counting the plays with the league videos. It is estimated that the “Datos_desempeño_Oficiales” form may contain approximately 1% error in the counting of the plays.
Due to external problems, on matchday 15, the playoff games and the final of the tournament were not counted. In the future, they will have to be included to establish a new annual comparison percentage. It is important to include the entire FABA tournament.
8. Conclusions:
We have reached the number we were expecting, a percentage of 90.28%. We identified that the majority of errors are due to poor application of the mechanics. Now there is a perspective per officer, allowing us to take action for each official.
9. Compilation of Additional Material:
The IFAF regulations were used to incorporate the fault codes correctly.
10. References:
Data was obtained from the following sources:
11. Special Thanks:
I want to thank the Officials Department for the data provided and also the officials who helped me resolve doubts about the data.
12. Annexes:
Tableau charts can be accessed at the following link: